
Overview
Title: Renewable Data Sheet
Grade: 6th Grade
Duration: 45 Minutes
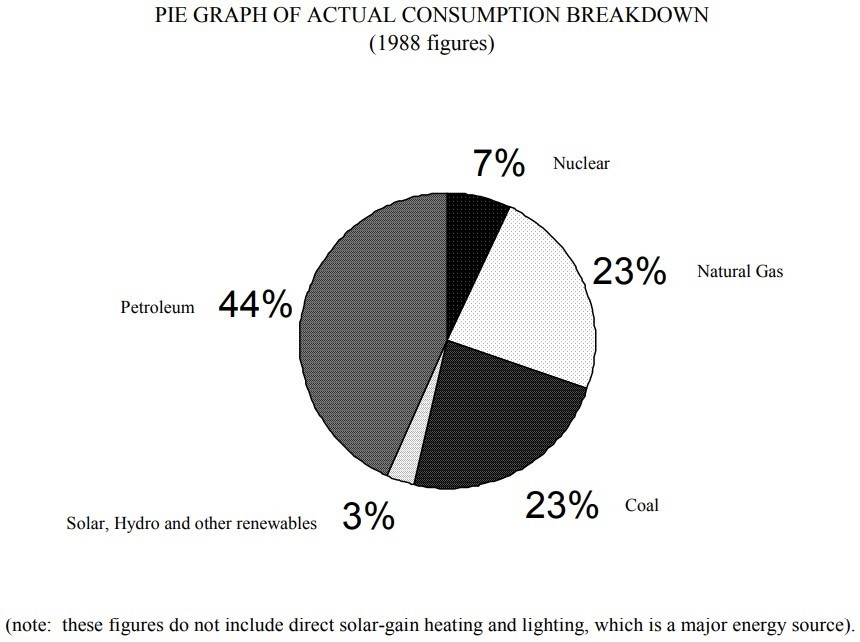
The United States derives approximately 97% of its total energy from nonrenewable sources. About 3% of our energy comes from renewable resources. From 1986 to 1988 energy consumption increased by 12%.
Draw Chart
This chart tells you how many beans to draw out of the container depending on the energy consumption rate you choose to simulate. Before beginning each year, predict how long it will take to remove all NONRENEWABLE beans. Complete the chart by recording the number of all beans left after each draw. Then, calculate the percentage of nonrenewable and renewable beans that remain after each draw.
Rules
- Remove only the number of beans indicated on your chart.
- Always remove 10 beans in the first year.
- Put renewable beans back in the container after each pull. Count ONLY the beans left in the container. NOTE: You may not be able to fill in all the boxes to year 12; or you may have to extend this chart on the back!
- The student pulling the beans out must be properly blindfolded. Consider it cheating if you pull beans based on how they “feel.”
- Keep all beans where they can be counted and returned to the jar.